Image Details
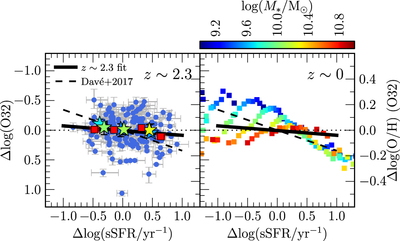
Caption: Figure 4.
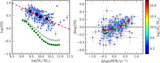
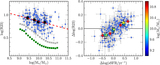
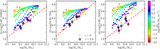
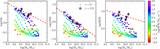
Deviation plots for O32 and metallicity estimated using O32, with points and lines the same as in Figure 3. In each panel, the left vertical axis shows the scale of the residuals in each line ratio, while the right vertical axis displays the scale of the corresponding residuals in metallicity. The best-fit slope for the z ∼ 2.3 Δlog(O/H) (O32) versus Δlog(sSFR/yr−1) relation is presented in Table 3.
Other Images in This Article
Copyright and Terms & Conditions
© 2018. The American Astronomical Society. All rights reserved.
Copyright ©
2026 Astronomy Image Explorer. All Rights Reserved.