Image Details
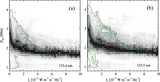
Caption: Figure 9.
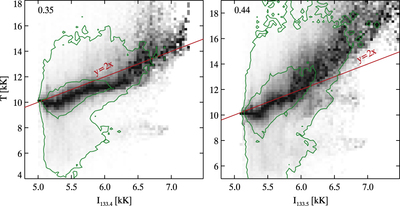
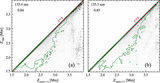
PDF of the temperature at the formation height as a function of the radiation temperature of the intensity at the line core for the C II 133.4 nm line (left panel) and the C II 133.5 nm line (right panel). Each column in the panels is scaled to maximum contrast to increase visibility. The green contours encompass 50% and 90% of all points. The Pearson correlation coefficient is given in the upper left corner of both panels. The red line denotes the line y = 2x.
Other Images in This Article
Show More
Copyright and Terms & Conditions
© 2015. The American Astronomical Society. All rights reserved.
Copyright ©
2026 Astronomy Image Explorer. All Rights Reserved.