Image Details
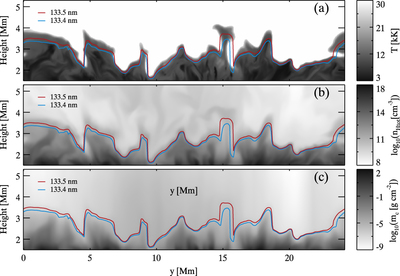
Caption: Figure 1.
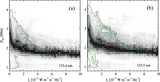
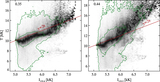
Temperature (a), total hydrogen population density (b), and column mass (c) as a function of height along a 2D cutout at ﹩x=12\;\mathrm{Mm}﹩ from the 3D model atmosphere. The maximum height across the line profile of ﹩{\tau }_{\nu }=1﹩ is shown for the C II 133.5 nm (red) and C II 133.4 nm (blue) lines.
Other Images in This Article
Show More
Copyright and Terms & Conditions
© 2015. The American Astronomical Society. All rights reserved.
Copyright ©
2026 Astronomy Image Explorer. All Rights Reserved.