Image Details
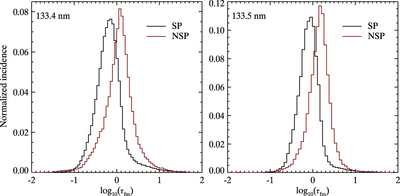
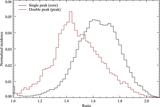
Caption: Figure 6.
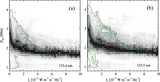
Histogram of average formation height on a ﹩\mathrm{lg}({\tau }_{0})﹩ scale (see Equation (4)) for single-peak (SP; black) and non-single-peak (NSP, red) profiles for the C II 133.4 nm line (left) and the C II 133.5 nm line (right).
Other Images in This Article
Show More
Copyright and Terms & Conditions
© 2015. The American Astronomical Society. All rights reserved.
Copyright ©
2026 Astronomy Image Explorer. All Rights Reserved.