Image Details
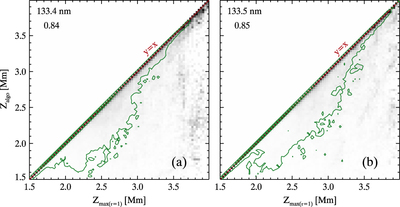
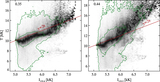
Caption: Figure 4.
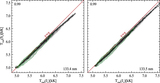
Probability distribution function (PDF) of ﹩\tau =1﹩ height at the line center determined by the line center finding algorithm as a function of the theoretical line core ﹩\tau =1﹩ height (the maximum ﹩\tau =1﹩ height over the line profile) for the C II 133.4 nm line (a) and the C II 133.5 nm line (b). Each column in the panels is scaled to maximum contrast to increase visibility. The inner green contour encompasses 50% and the outer contour encompasses 90% of all points. The red line denotes y = x. The Pearson correlation coefficient is given in the upper left corner.
Other Images in This Article
Show More
Copyright and Terms & Conditions
© 2015. The American Astronomical Society. All rights reserved.
Copyright ©
2026 Astronomy Image Explorer. All Rights Reserved.