Image Details
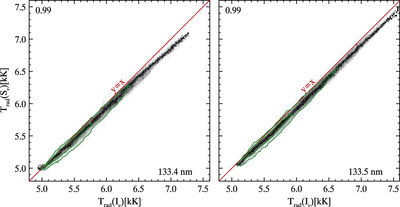
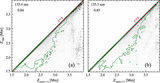
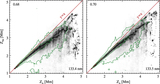
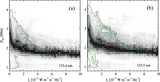
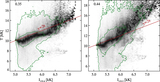
Caption: Figure 5.
PDF of the radiation temperature of the source function at the ﹩{\tau }_{\nu }=1﹩ height as a function of the radiation temperature of the intensity. The correlation is shown for the theoretical line core (the wavelength where the height where optical depth unity is the maximum). Each column in the panels is scaled to maximum contrast to increase visibility. The green contours encompass 50% and 90% of all points. The Pearson correlation coefficient is given in the upper left corner, the red line denotes y = x.
Other Images in This Article
Show More
Copyright and Terms & Conditions
© 2015. The American Astronomical Society. All rights reserved.
Copyright ©
2026 Astronomy Image Explorer. All Rights Reserved.