Image Details
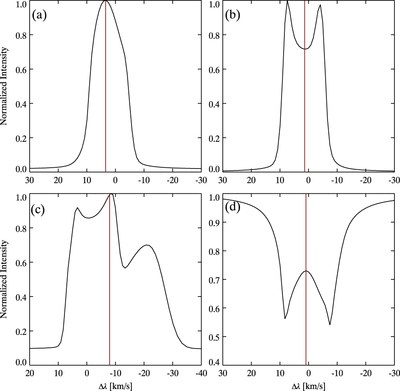
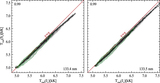
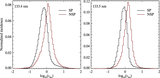
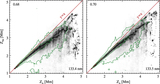
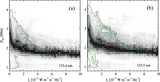
Caption: Figure 2.
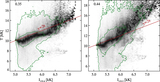
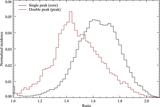
Various C II line profiles from our simulation with the position of the line center using our peak finding algorithm shown with a red vertical line: typical single-peak emission line profile (a), double-peak profile with central depression (b), profile showing three peaks (c), and absorption line profile (d).
Other Images in This Article
Show More
Copyright and Terms & Conditions
© 2015. The American Astronomical Society. All rights reserved.
Copyright ©
2026 Astronomy Image Explorer. All Rights Reserved.