Image Details

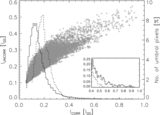
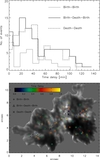
Caption: Figure 8.
Relation between L bd and L tj. The scatter plot between birth–death distance and trajectory length shown as gray cross symbols. The square symbols represent maximum L bd for a given L tj within a bin of 100 km. The straight line is a linear fit to the scatter of the square symbols.
Other Images in This Article

Copyright and Terms & Conditions
© 2012. The American Astronomical Society. All rights reserved.
Copyright ©
2025 Astronomy Image Explorer. All Rights Reserved.