Image Details

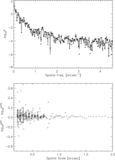
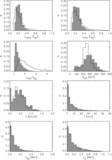
Caption: Figure 2.
Change in umbral intensity after removal of stray light. Displayed is a scatter plot of uncorrected ( I uncorr) and corrected ( I corr) blue continuum intensity in the umbra. Note that the axes are scaled differently. The solid and dashed lines refer to the intensity histograms of the CR and UN filtergrams, respectively, with a bin size of 0.01 I QS. A magnified version of the trailing halves of the histograms is shown in the inset.
Other Images in This Article

Copyright and Terms & Conditions
© 2012. The American Astronomical Society. All rights reserved.
Copyright ©
2025 Astronomy Image Explorer. All Rights Reserved.