Image Details

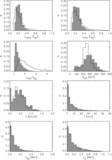
Caption: Figure 1.
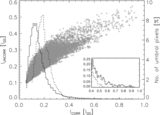
Top: azimuthally averaged power spectra of single (solid line) and average of four blue continuum filtergrams (cross symbol).
Bottom: difference in power spectra of a single and average filtergram as a function of spatial scale (gray plus symbols).
The black cross symbols represent average values of the difference in bins of 0
![]() 05 with the vertical bars denoting the rms value.
05 with the vertical bars denoting the rms value.
Other Images in This Article

Copyright and Terms & Conditions
© 2012. The American Astronomical Society. All rights reserved.
Copyright ©
2025 Astronomy Image Explorer. All Rights Reserved.