Image Details

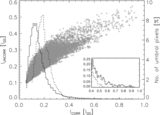
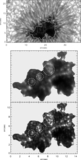
Caption: Figure 10.
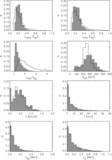
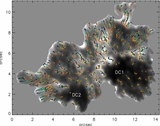
Top: histograms of time delays associated with each event class: BB (gray), BDB (solid black), DD (black dotted). Bottom: spatial distribution of the occurrences of all three event classes (see the text), which are indicated by the plus, triangle, and cross symbols, respectively. The color coding indicates the normalized time delay associated with that spatial location for each event class. BB: Birth–Birth, BDB: Birth–Death–Birth, and DD: Death–Death.
Other Images in This Article

Copyright and Terms & Conditions
© 2012. The American Astronomical Society. All rights reserved.
Copyright ©
2025 Astronomy Image Explorer. All Rights Reserved.