Image Details

Caption: Figure 6.
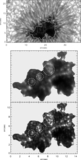
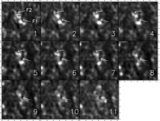
Depiction of MLT algorithm for three intensity levels. The original image comprises of an arbitrary distribution of intensities. The maximum and minimum intensity range is split into three intermediate levels and the objects are sequentially tagged from the highest to the lowest level. The object boundary is determined using the background image from which the features can be isolated as shown in the bottom right panel.
Other Images in This Article

Copyright and Terms & Conditions
© 2012. The American Astronomical Society. All rights reserved.
Copyright ©
2025 Astronomy Image Explorer. All Rights Reserved.