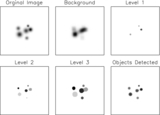
Image Details

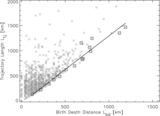
Caption: Figure 7.
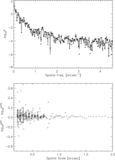
Histogram of various UD properties for both time sequences. Mean intensity— I mean, maximum intensity— I max, maximum-to-background intensity ratio— I max/ I bg, effective diameter— D eff, horizontal speed— V, lifetime— T, birth–death distance— L bd, and trajectory length— L tj. Bin sizes are 0.05 I QS, 0.05 I QS, 0.15, 40 km, 100 m s −1, 2 minutes, 50 km, and 75 km, respectively. The gray shaded and unshaded histograms correspond to the UN and CR time sequences, respectively. The y-axis represents the fraction of UDs in each bin.
Other Images in This Article

Copyright and Terms & Conditions
© 2012. The American Astronomical Society. All rights reserved.
Copyright ©
2025 Astronomy Image Explorer. All Rights Reserved.