

Image Details
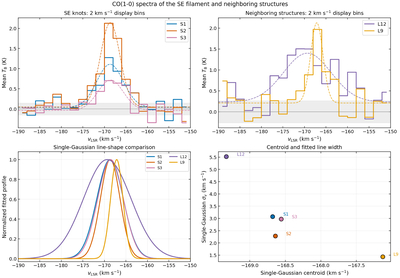
Caption: Figure B1.
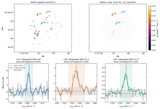
CO(1–0) spectral comparison of the SE filament and neighboring compact structures. The stepped spectra are displayed in 2 km s−1 bins, the dashed curves show single-Gaussian fits to the 1 km s−1 channels of the regridded cube, and the gray bands indicate the approximate rebinned rms. Upper left: spectra of S1–S3 extracted in matched 3″-radius apertures. Upper right: spectra of L12 and L9 averaged over their fixed SoFiA footprints. Lower left: peak-normalized single-Gaussian models for all five structures. Lower right: fitted centroids and velocity dispersions. The similar centroids of S1–S3 support their classification as a single clumpy filament. L12 has a compatible but broader and less regular profile, while L9 is redshifted and narrower. Because the extraction regions differ, absolute brightness should not be compared between the upper panels.
Other Images in This Article
Copyright and Terms & Conditions
© 2026. The Author(s). Published by the American Astronomical Society.

