

Image Details
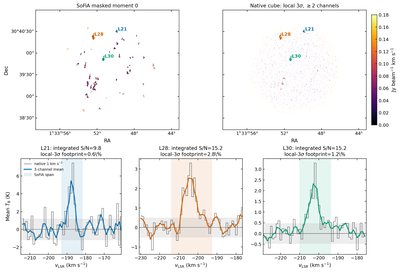
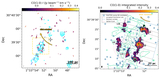
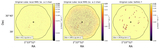
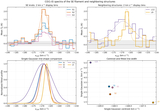
Caption: Figure A2.
Why a reliable SoFiA source can appear absent from a directly clipped moment map. Top: SoFiA-masked moment 0 and the native-cube local 3σ moment map, displayed with a common linear scale. Colored outlines mark three representative SoFiA footprints. Bottom: footprint-averaged native spectra (gray steps) and three-channel running means (colored curves). Colored bands show each source’s SoFiA velocity span and gray horizontal bands show the footprint-averaged rms. The integrated S/N is measured by SoFiA over the 3D source mask; the quoted local 3σ percentage is the fraction of the 2D footprint retained by the direct consecutive-channel clip. Spatial and spectral averaging reveals coherent lines even where few individual native pixels pass the per-channel threshold.
Other Images in This Article
Copyright and Terms & Conditions
© 2026. The Author(s). Published by the American Astronomical Society.

