

Image Details
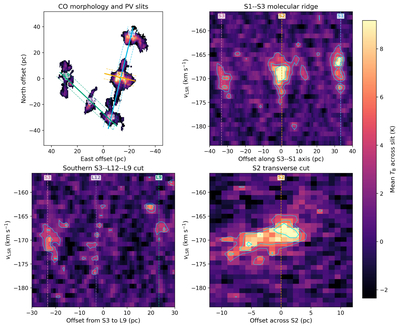
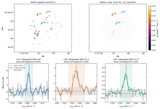
Caption: Figure 5.
Position–velocity structure of the SE filament and neighboring CO emission. From upper left to lower right, the panels show the integrated-intensity map with the three adopted slits, the PVD along the S1–S3 axis, the PVD along the candidate S3–L12–L9 sequence, and the transverse PVD through S2. Dashed lines in the map indicate the slit widths. Colors show the mean CO brightness temperature in the unmasked cube, and cyan contours mark emission at 3, 5, and 8 times the PVD rms. The displayed velocity range is −184 to −156 km s−1. The S1–S3 PVD is dominated by the three compact knots, the S3–L12–L9 cut lacks a continuous bridge, and the S2 transverse PVD shows the clearest organized velocity shift.
Other Images in This Article
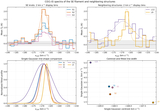
Copyright and Terms & Conditions
© 2026. The Author(s). Published by the American Astronomical Society.

