

Image Details
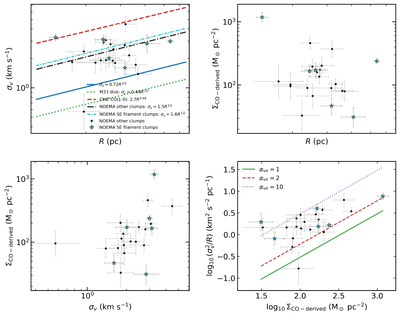
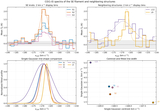
Caption: Figure 6.
Properties of NOEMA CO(1–0) compact clumps identified with PYCPROPS. Cyan stars mark clumps associated with the SE filament, and black circles mark the other clumps in the field. Upper left: radius–velocity dispersion relation, compared with the Milky Way disk relation (P. M. Solomon et al. 1987), the M33 disk-wide relation (K. Muraoka et al. 2023), and the CMZ fit (T. Oka et al. 1998); dashed–dotted lines show fits with a fixed R1/2 slope to the two NOEMA subsamples. Upper right: radius–surface density relation. Lower left: surface density–velocity dispersion relation. Lower right: size–line width–surface density relation, with lines corresponding to virial parameters of 1, 2, and 10.
Other Images in This Article
Copyright and Terms & Conditions
© 2026. The Author(s). Published by the American Astronomical Society.

