

Image Details
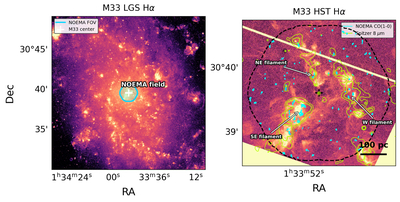
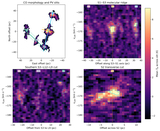
Caption: Figure 1.
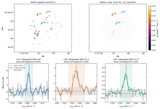
Global context and local morphology of the central NOEMA field. Left: Local Group Galaxy Survey Hα image of M33 (P. Massey et al. 2006, 2007). The cyan outline marks the NOEMA field, and the cross marks the adopted M33 center. Right: continuum-subtracted HST Hα image of the NOEMA field. Cyan contours show NOEMA CO(1–0) integrated intensity with levels 0.04, 0.07, 0.12, 0.20, 0.32 Jy beam−1 km s−1, yellow contours show Spitzer/IRAC 8 μm emission at 7.4 and 11.1 MJy sr−1 (D. A. Dale et al. 2009), and the black dashed curve marks the NOEMA footprint. The arrows indicate three prominent filamentary ridges, identified by their projected locations as the SE, northeastern (NE), and western (W) filaments; the SE filament is the structure analyzed in detail in this work.
Other Images in This Article
Copyright and Terms & Conditions
© 2026. The Author(s). Published by the American Astronomical Society.

