

Image Details
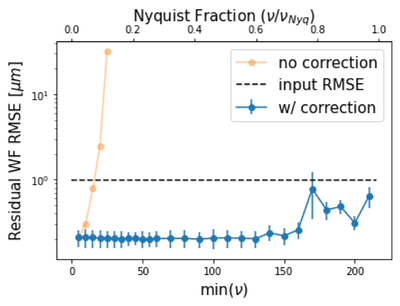
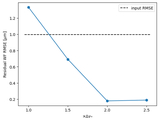
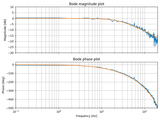
Caption: Figure 9.
The rms of the difference between the recovered wave fronts and the injected wave front as a function of the minimum frequency ν used. The recovered wave fronts were reconstructed using CACOFONI control matrices taken at different frequency ranges. The blue curve shows that the usable frequency range of CACOFONI extends to about 160 Hz, which is equivalent to 70% of the Nyquist frequency given the system ran at 434 Hz when the data was taken. To show the importance of the system frequency response function (shown in Figure 10) discussed in Section 2, we present the orange curve that increases rapidly as the min(ν) increases. This effect takes place because when the interaction matrices are not corrected or scaled by the frequency response function of the system, the output signals of the system would be much smaller than the input signals of the system, causing large scaling issues in the RMSE.
Other Images in This Article

Copyright and Terms & Conditions
© 2026. The Author(s). Published by the American Astronomical Society.

