

Image Details
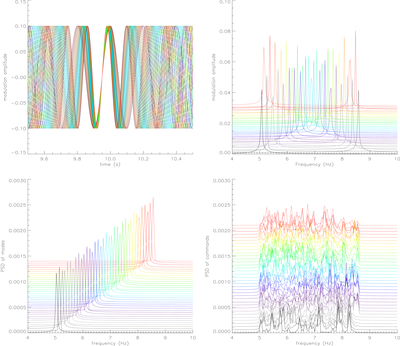
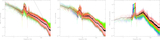
Caption: Figure 1.
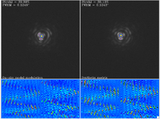
Top left: the commands sent to the 36 actuators of the ASM, with even actuators increasing in frequency and odd actuators decreasing; actuator 1 is black, actuator 36 is red and the actuator number increases through the rainbow palette. The top right plot shows the same modulation (with the same color coding) as a function of (positive) frequency, but with an arbitrary constant offset for better visualization. The bottom plots show a modal frequency comb (left), projected onto the actuators (right); despite each actuator having a complex frequency content, the demodulation of the WFS signals in modal space allows us to measure the interaction matrix.
Other Images in This Article
Copyright and Terms & Conditions
© 2026. The Author(s). Published by the American Astronomical Society.

