

Image Details
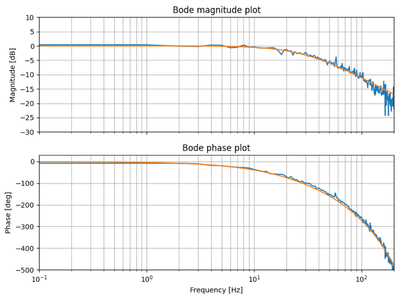
Caption: Figure 10.
The frequency response function of the ASM system in the laboratory when the min(ν) data (Figure 9) was taken. The system was running at 434 Hz. The blue curve is the raw data, and the orange curve is the best-fit model to the blue curve. The model is used for the system frequency response function correction in this section.
Other Images in This Article
Copyright and Terms & Conditions
© 2026. The Author(s). Published by the American Astronomical Society.

Copyright ©
2026 Astronomy Image Explorer. All Rights Reserved.
