

Image Details
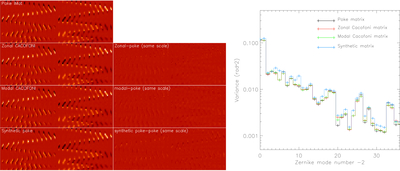
Caption: Figure 3.
Left: the 288 × 36 interaction matrices. At the top is the poke matrix, measured in the laboratory, with x-slopes on the left, y-slopes on the right, and actuator number increasing vertically (the three rings of actuators are visible as three “>” shapes). Below are two CACOFONI matrices obtained with zonal and modal modulation, respectively, and a synthetic matrices obtained by fitting the poke matrix. The difference (on the same scale as the interaction matrices) between the different matrices is shown next to them. Right: using a playback buffer containing commands corresponding to atmospheric turbulence, we closed the loop with the control matrices obtained from the interaction matrices on the left. From the centroids, we computed the phase projected onto Zernike polynomials and compared the residual after correction. The modal variance for the poke matrix (black), CACOFONI with zonal modulation (red), and modal modulation (green) are indistinguishable. The performance with a synthetic matrix (blue) provides systematically poorer correction, due to the simplex synthetic matrix algorithm used with underoptimized performance.
Other Images in This Article
Copyright and Terms & Conditions
© 2026. The Author(s). Published by the American Astronomical Society.

