

Image Details
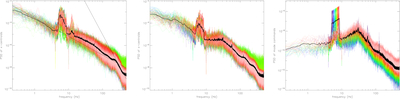
Caption: Figure 5.
The on-sky, open-loop power spectral density of the x-centroids is shown on the left plot, when the modal modulation is applied: it can be seen to be about an order of magnitude above the level of the atmospheric turbulence, which has a slope of f−5/3 at low frequencies, which turns into f−17/3 at high frequencies when the turbulence is averaged within the subapertures (﹩f\gt \bar{v}/d﹩). The middle plot shows the same PSD in closed loop (but with a low loop gain, which explains why the low frequency part of the spectrum is similar to the open loop). However, in closed loop, the modulation is around 2 orders of magnitude above the corrected turbulence as can be seen on the PSD of the commands (in modal coefficient space, shown in the right plot).
Other Images in This Article

Copyright and Terms & Conditions
© 2026. The Author(s). Published by the American Astronomical Society.

