

Image Details
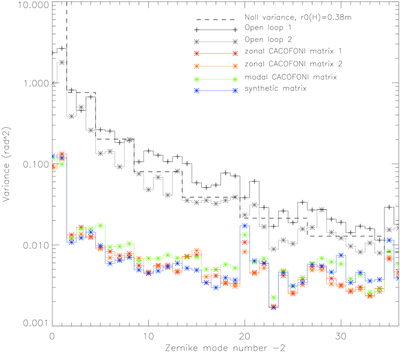
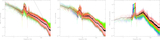
Caption: Figure 7.
Zernike modal variance spectrum: the Noll variance for r0(H) = 38 cm is shown as a dashed line, and two consecutive open-loop measurements obtained on the night of 2024 April 25 are shown as black crosses and gray stars. Closed-loop measurements obtained within 40 minutes are shown with the following color coding: red and orange were obtained by closing the loop using two different CACOFONI matrices obtained using zonal modulation; the green curve shows the Zenike power spectrum obtained with a CACOFONI matrix obtained with modal modulation, while the blue data is for measurements obtained using a synthetic control matrix. The performance of the modal CACOFONI matrix seems to be slightly worse than the zonal ones. The performance of our synthetic matrix, here only as rough comparison, shows similar modal variances.
Other Images in This Article

Copyright and Terms & Conditions
© 2026. The Author(s). Published by the American Astronomical Society.

