

Image Details
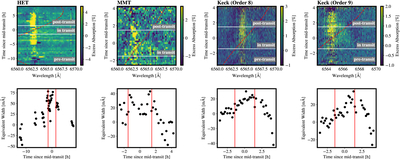
Caption: Figure 7.
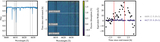
Top: excess Hα absorption spectra of WASP-12 b, in percent, in the stellar rest frame as a function of time and wavelength as measured in A. G. Jensen et al. (2018) with HET and in S. Vissapragada et al. (2026) with MMT and Keck. The red dashed line shows the position of the Hα line following the planet’s orbital motion. White horizontal lines mark the beginning and end of transit. We note that for HET, gaps in the equivalent width time series reflect the nonuniform time sampling of the HET observations, which were compiled from multiple shorter visits at different orbital phases rather than a single continuous transit observation; equivalent widths are shown only at the time stamps for which HET data exist. Bottom: evolution of the Hα equivalent width over the course of the HET, MMT, and Keck observations.
Other Images in This Article
Copyright and Terms & Conditions
© 2026. The Author(s). Published by the American Astronomical Society.

