

Image Details
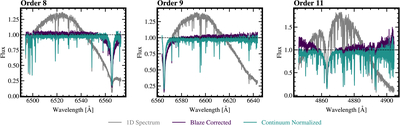
Caption: Figure 2.
Example WASP-12 spectrum (gray) shown at different points in the data reduction process for orders 8 (left), 9 (middle), and 11 (right). The gray data corresponds to the 1D wavelength-calibrated spectrum produced from the KPF DRP (S. R. Gibson et al. 2016). The purple data show the same spectrum after the blaze correction is performed, while the teal data show the spectrum after blaze correction and continuum normalization (A. Householder et al. 2025). All wavelengths are given in vacuum and are in the barycentric rest frame.
Other Images in This Article
Copyright and Terms & Conditions
© 2026. The Author(s). Published by the American Astronomical Society.

Copyright ©
2026 Astronomy Image Explorer. All Rights Reserved.
