

Image Details
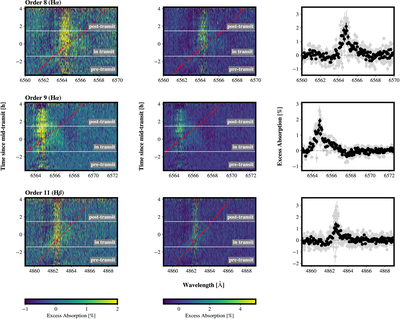
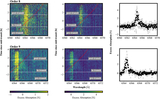
Caption: Figure 3.
Left column: excess absorption spectra of WASP-12 b, in percent, in the stellar rest frame as a function of time and wavelength for orders 8 and 9 on the red chip and order 11 on the green chip of the KPF CCDs. The white horizontal lines mark the beginning (bottom) and end (top) of transit. In all three rows, the red dashed line shows the position of the Hα (orders 8 and 9) and Hβ (order 11) lines following the planet’s orbital motion. The scaling is chosen to show the full extent of absorbing gas. Middle column: same as the left column but with scaling chosen to show the location of the peak excess absorption. Right: average in-transit excess absorption spectrum of WASP-12 b in the stellar rest frame as observed with KPF. The gray points are unbinned data; the black points are binned down to the instrumental resolving power of R ∼ 98,000.
Other Images in This Article
Copyright and Terms & Conditions
© 2026. The Author(s). Published by the American Astronomical Society.

