

Image Details
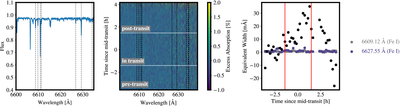
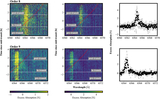
Caption: Figure 6.
Left: example stellar spectrum of WASP-12. Vertical lines indicate wavelengths of stellar absorption lines. Middle: excess absorption spectra of WASP-12 b, in percent, in the stellar rest frame as a function of time and wavelength. Right: representative equivalent width of known stellar Fe I absorption lines (gray and purple points) as a function of time. Black points track the Hα equivalent width in order 9.
Other Images in This Article
Copyright and Terms & Conditions
© 2026. The Author(s). Published by the American Astronomical Society.

Copyright ©
2026 Astronomy Image Explorer. All Rights Reserved.
