

Image Details
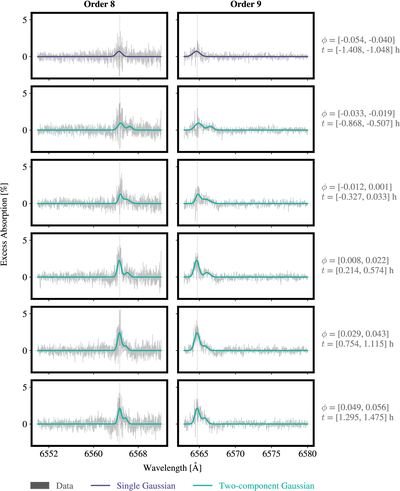
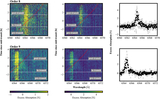
Caption: Figure 4.
Joint two-component Gaussian fit to the in-transit Hα excess absorption spectra in orders 8 (left) and 9 (right). Each row corresponds to a stacked frame comprising the average of every three consecutive in-transit exposures, with orbital phase increasing downward. The orbital phase range of each stacked frame is indicated to the right of each row along with the time relative to midtransit the stacked frame spans in hours. The best-fit model is overplotted in each panel: a purple curve indicates a single-Gaussian model is preferred while a teal curve indicates a two-component Gaussian model is preferred.
Other Images in This Article
Copyright and Terms & Conditions
© 2026. The Author(s). Published by the American Astronomical Society.

