

Image Details
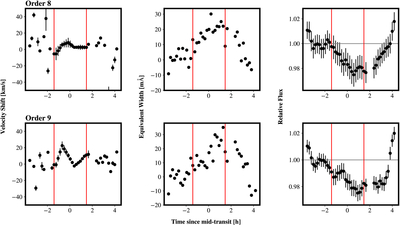
Caption: Figure 5.
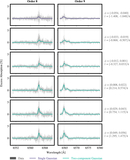
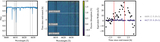
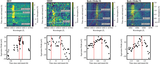
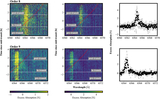
Left: velocity shift of the Hα residuals throughout the observation for orders 8 and 9 on the red chip of the KPF CCDs. The characteristic up-then-down shape of the in-transit velocity shift is in good agreement with predictions from Figure 4 of M. MacLeod et al. (2025) for stream-like outflows. Red lines mark the beginning and end of transit. We note that the large scatter in values preingress is due to the low SNR of the excess absorption signal in this region of the spectrum. Middle: evolution of the Hα equivalent width over the course of the observation. Bottom: the band-integrated light curve of WASP-12 b within 0.15 Å of the Hα peak.
Other Images in This Article
Copyright and Terms & Conditions
© 2026. The Author(s). Published by the American Astronomical Society.

