

Image Details
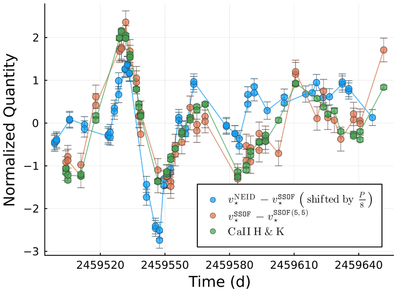
Caption: Figure 13.
Comparing ﹩{v}_{\star }^{{\rm{NEID}}}-{v}_{\star }^{{\mathtt{SSOF}}}﹩ (blue) and ﹩{v}_{\star }^{{\mathtt{SSOF}}(5,5)}-{v}_{\star }^{{\mathtt{SSOF}}}﹩ (orange) with Ca II H&K variations measured by NEID’s DRP (green) for HD 26965. All series are shown after subtracting their mean and dividing them element-wise by their respective rms to bring them to the same scale. Shifting ﹩{v}_{\star }^{{\rm{NEID}}}-{v}_{\star }^{{\mathtt{SSOF}}}﹩ back by 5 days (1/8 of the measured orbital period of ≃40 days) makes the signal appear very similar to Ca II H&K . Even more strikingly, ﹩{v}_{\star }^{{\mathtt{SSOF}}(5,5)}-{v}_{\star }^{{\mathtt{SSOF}}}﹩ traces Ca II H&K almost exactly. The Pearson correlation coefficient between Ca II H&K and ﹩{v}_{\star }^{{\mathtt{SSOF}}(5,5)}-{v}_{\star }^{{\mathtt{SSOF}}}﹩ is 0.945.
Other Images in This Article

Show More
Copyright and Terms & Conditions
© 2026. The Author(s). Published by the American Astronomical Society.

