

Image Details
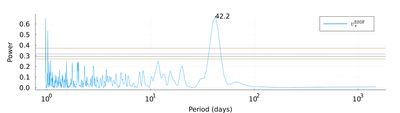
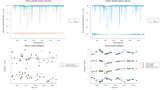
Caption: Figure 12.
Lomb–Scargle periodogram of ﹩{v}_{\star }^{{\mathtt{SSOF}}}﹩ for HD 26965. The period of the maximum peak is labeled. The horizontal lines are the 95%, 97.72% (one-sided 2σ), 99%, and 99.87% (one-sided 3σ) false alarm probability powers based on the distribution of maximum powers from many Lomb–Scargle periodograms of bootstrap reorderings of ﹩{v}_{\star }^{{\mathtt{SSOF}}}﹩. The dominant signal remaining is very significant and at the stellar rotation period.
Other Images in This Article

Show More
Copyright and Terms & Conditions
© 2026. The Author(s). Published by the American Astronomical Society.

Copyright ©
2026 Astronomy Image Explorer. All Rights Reserved.
