

Image Details
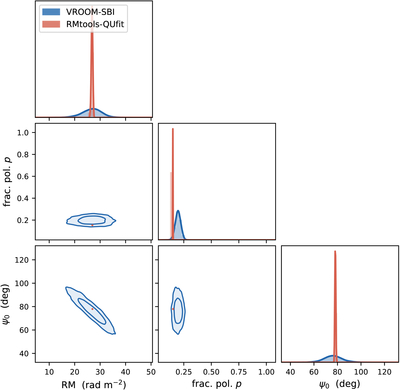
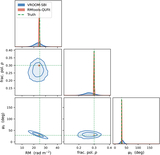
Caption: Figure 9.
Posterior corner plot for a representative pixel in MACS J1752+4440 (p0 ≈ 0.25, RM ≈ 25 rad m−2). Blue contours show the VROOM-SBI posterior (68% and 95% credible regions); the red curve shows the RMTOOLS-QUfit posterior. The RMTOOLS point estimate falls within the VROOM-SBI 68% credible region in every projection.
Other Images in This Article
Copyright and Terms & Conditions
© 2026. The Author(s). Published by the American Astronomical Society.

Copyright ©
2026 Astronomy Image Explorer. All Rights Reserved.
