

Image Details
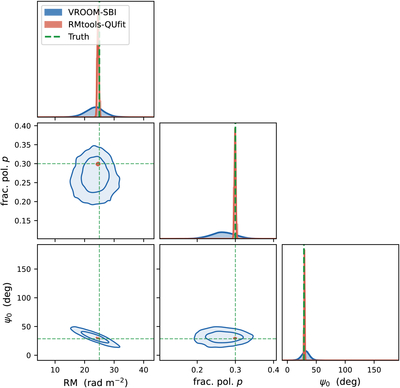
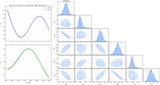
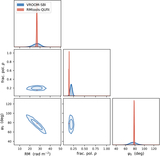
Caption: Figure 4.
Posterior corner plot for a simulated Faraday-thin source. Blue filled contours show the VROOM-SBI posterior (68% and 95% credible regions), the red curve shows the RMTOOLS-QUfit posterior, and the green dashed lines mark the injected ground truth. VROOM-SBI recovers all three parameters in agreement with the truth, with somewhat broader posteriors than the likelihood-based sampler.
Other Images in This Article
Copyright and Terms & Conditions
© 2026. The Author(s). Published by the American Astronomical Society.

Copyright ©
2026 Astronomy Image Explorer. All Rights Reserved.
