

Image Details
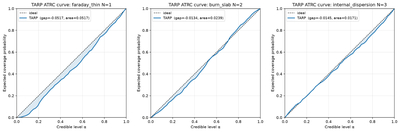
Caption: Figure A1.
Representative TARP ATRC curves. Left: Faraday thin N = 1, the largest deviation in the matrix and formally flagged underconfident, yet within ≲5% coverage of the ideal diagonal at every credible level. Center: Burn slab N = 2, a typical calibrated example. Right: internal dispersion N = 3, calibrated at the information floor set by the noise model. Shaded regions show the deviation from the ideal diagonal (dashed).
Other Images in This Article
Copyright and Terms & Conditions
© 2026. The Author(s). Published by the American Astronomical Society.

Copyright ©
2026 Astronomy Image Explorer. All Rights Reserved.
