

Image Details
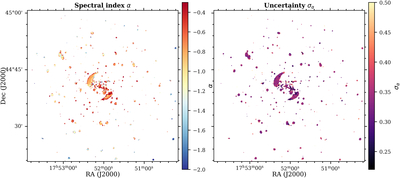
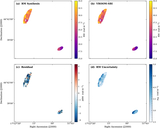
Caption: Figure 6.
Spectral-index map of MACS J1752+4440 derived from the VROOM-SBI total-intensity spectral-shape posterior (Section 3.4). Left: posterior mean spectral index α, clipped to [−2.0, −0.3] to highlight structure in the relic. Right: posterior standard deviation σα.
Other Images in This Article
Copyright and Terms & Conditions
© 2026. The Author(s). Published by the American Astronomical Society.

Copyright ©
2026 Astronomy Image Explorer. All Rights Reserved.
