

Image Details
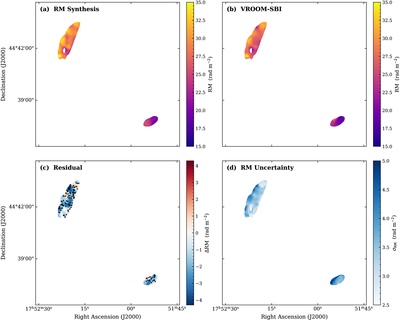
Caption: Figure 7.
Faraday rotation-measure (RM) maps of the MACS J1752+4440 radio relic. Panel (a) shows the peak RM recovered by RM synthesis, and panel (b) shows the posterior mean RM from VROOM-SBI; both share the same color scale (15–35 rad m−2). All pixels below 5σP, where σP is the noise on the polarized intensity image, are masked. Panel (c) shows the residual between the two methods (VROOM-SBI − RM synthesis); the 100 pixels selected for independent QU-fitting validation are overlaid as black points (see Section 5.3). Panel (d) shows the posterior standard deviation of the VROOM-SBI RM, quantifying the per-pixel inference uncertainty. All maps are shown at the native angular resolution of the L-band observations.
Other Images in This Article
Copyright and Terms & Conditions
© 2026. The Author(s). Published by the American Astronomical Society.

