

Image Details
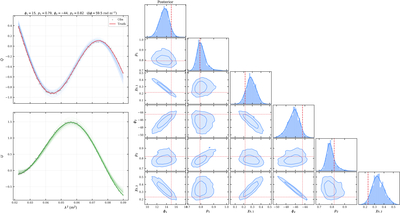
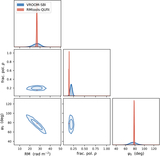
Caption: Figure 5.
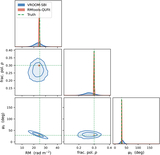
Two-component recovery for a representative case with Δϕ = 59.5 rad m−2 (ϕ1 = +15, ϕ2 = −44.5 rad m−2). Left: simulated Q and U spectra (gray points) with posterior-predictive draws (blue); the characteristic beat pattern of two interfering Faraday screens is clearly visible. Right: joint-posterior corner plot for all six parameters; contours enclose 68% and 95% of the posterior mass, and red dashed lines mark the injected truth. Both rotation measures and polarization amplitudes are recovered without significant bias.
Other Images in This Article
Copyright and Terms & Conditions
© 2026. The Author(s). Published by the American Astronomical Society.

Copyright ©
2026 Astronomy Image Explorer. All Rights Reserved.
