

Image Details
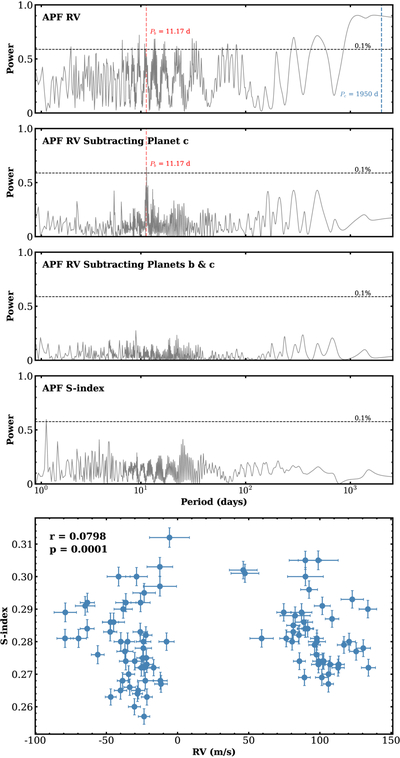
Caption: Figure 2.
Top panel: periodogram of all APF RV measurements. The blue vertical dashed line indicates where the period of planet c dominates and the red vertical dashed line indicates where the period of planet b dominates. Second panel: RV periodogram after subtracting planet c’s trend. Only planet b’s period remains dominant. Third panel: RV periodogram after subtracting both planet b and c’s trend. No period meets the power criteria necessary for another object in the system. Fourth panel: periodogram of all APF S-index measurements. There is no significant power found at either planet b or c’s period indicating a lack of stellar magnetic activity on either timescale. The black horizontal dashed line in each of the above panels indicates a False Alarm Probability of 0.1%. Bottom panel: scatter plot of APF S-index measurements versus their corresponding residual APF RV measurements. Both the Pearson correlation coefficient (r) and p-value (p) are shown in the top left of the panel. Together, these values indicate a statistically significant noncorrelation in the data.
Other Images in This Article
Copyright and Terms & Conditions
© 2026. The Author(s). Published by the American Astronomical Society.

