

Image Details
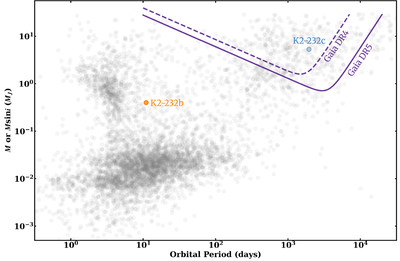
Caption: Figure 5.
Mass versus orbital period diagram for entire exoplanet population. Marker transparency values are determined by the distance to the system with fainter points being further away and more opaque points being closer by. The location of K2-232b and K2-232c are labeled on this diagram (in orange and blue respectively). The purple dashed line indicates the detection sensitivity of Gaia DR4 and the purple solid line, for that of DR5. These sensitivities are calculated for a 1 M⊙ star viewed from 100 pc with an astrometric precision of 34 μas (e.g., M. Perryman et al. 2014) for a 5 and 10 yr campaign. K2-232c falls well within the sensitivity region for Gaia DR4 suggesting a likely detection.
Other Images in This Article
Copyright and Terms & Conditions
© 2026. The Author(s). Published by the American Astronomical Society.

