

Image Details
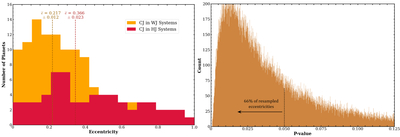
Caption: Figure 4.
Left panel: histogram of cold Jupiter orbital eccentricities in warm-Jupiter (orange) and hot-Jupiter (red) systems resampled 100,000 times. The dark orange and dark red vertical dashed lines represent the mean eccentricity for cold Jupiters in warm and hot Jupiter systems, respectively. Right panel: histogram of the p-value distribution calculated from 100,000 iterations of the two-sample permutation-based Anderson–Darling test comparing both eccentricity distributions. The black dashed line corresponds to p = 0.05, below which 66% of our test iterations lie. These results robustly indicate cold Jupiters hosting inner hot-Jupiter companions have higher mean orbital eccentricities than when hosting inner warm-Jupiter companions.
Other Images in This Article
Copyright and Terms & Conditions
© 2026. The Author(s). Published by the American Astronomical Society.

