

Image Details
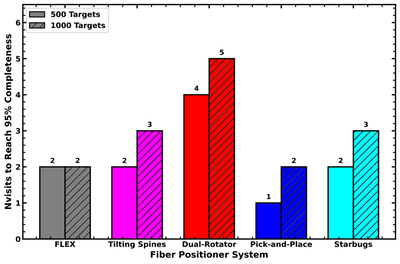
Caption: Figure 7.
Cost comparison across different fiber-positioner configurations for 500 fibers. The bars indicate the minimum number of visits (Nvisits) required for each positioner system to achieve a cumulative target completeness threshold of 95%. Solid colored bars denote 500 targets, while hatched bars indicate performance under 1000 targets.
Other Images in This Article
Copyright and Terms & Conditions
© 2026. The Author(s). Published by the American Astronomical Society.

Copyright ©
2026 Astronomy Image Explorer. All Rights Reserved.
