

Image Details
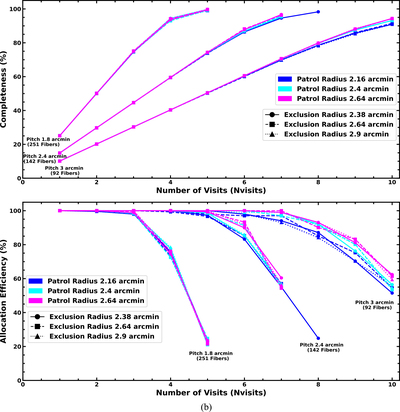
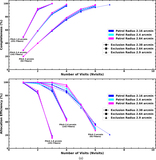
Caption: Figure 4.
(a) The performance of three different fiber pitches with varying patrol and exclusion radii within a 0.5 diameter (0.196 deg2) FoV. The top panel displays the completeness as a function of the number of visits (Nvisits) for 2551 targets deg−2 (500 targets). The bottom panel shows the efficiency as a function of Nvisits for the same target density. There are three groupings of results, which correspond to the chosen fiber pitch. The results showing the best performance (highest completeness for the fewest number of visits) come from the simulations with the smallest pitch (largest number of fibers). The colors and the symbols correspond to PR. The choice of line styles is to aid visibility only, without any link to the parameter values. The numbers against each parameter in the key are given in arcsec. It is clear that the primary factor in delivering the best performance is the smallest fiber pitch (largest fiber density or number). The PR and ER have a secondary impact when fiber pitch is fixed. (b) Here showing results for 5102 targets deg−2 (1000 targets).
Other Images in This Article
Copyright and Terms & Conditions
© 2026. The Author(s). Published by the American Astronomical Society.

