

Image Details
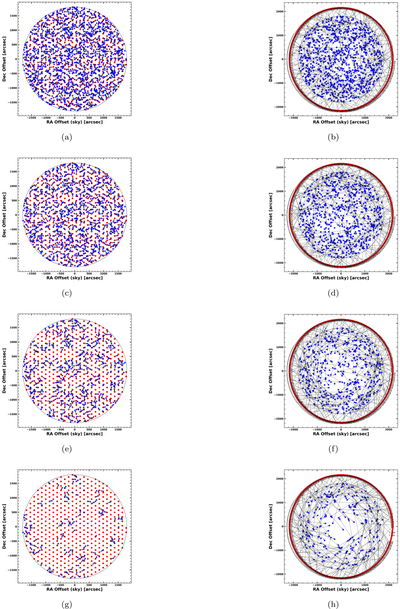
Caption: Figure 3.
Different stages of fiber-to-target allocation. The left panels, (a), (c), (e), and (g), illustrate fiber-to-target allocation in a hexagonal fiber-positioner system (parallel positioner). Each panel illustrates the allocation of fibers to targets in a fixed configuration and displays the allocation of 500 fibers to 1500 targets within a 1﹩\mathop{.}\limits^{{\unicode{x000b0}}}﹩0 diameter FoV in one of the GAMA (G09) fields. The fiber home positions are represented in red, and target positions are marked in blue. Black arrows show the allocation of fibers to specific targets. The right panels, (b), (d), (f), and (h), illustrate the fiber-to-target allocation in a pick-and-place fiber-positioner system (sequential positioner). Each panel displays the allocation of 240 fibers to 960 targets within a 1﹩\mathop{.}\limits^{{\unicode{x000b0}}}﹩0 diameter FoV in one of the GAMA (G09) fields. The fiber home positions are represented in red around the edge of the FoV, and target positions are indicated by blue markers within the FoV. Gray arrows show the allocation of fibers to targets. In both sets of panels, the first three panels ((a), (c), (e) and (b), (d), (f)) represent the first three field visits, while the last panel ((g) and (h)) shows the final visit of fiber allocations.
Other Images in This Article
Copyright and Terms & Conditions
© 2026. The Author(s). Published by the American Astronomical Society.

