

Image Details
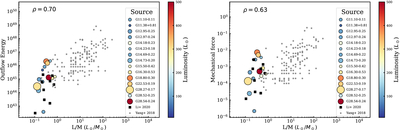
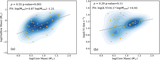
Caption: Figure 6.
Outflow energy (Eout) and outflow force (Fout) are plotted against the L/M ratio for each clump. Clump luminosities (color coded) and masses (size coded) for the sources in this work are adopted from J. Yuan et al. (2017). The black squares indicate the sources from S. Li et al. (2020), and the gray stars indicate the sources from A. Y. Yang et al. (2018). The Spearman’s rank correlation coefficients ρ are provided in each panel.
Other Images in This Article
Copyright and Terms & Conditions
© 2026. The Author(s). Published by the American Astronomical Society.

Copyright ©
2026 Astronomy Image Explorer. All Rights Reserved.
