

Image Details
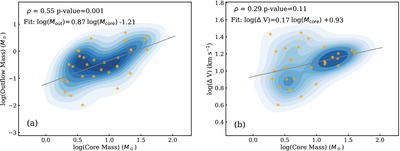
Caption: Figure 5.
(a) Core mass versus outflow mass, with the bivariate Gaussian kernel density estimate (KDE) shown as blue contour lines. (b) Core mass versus outflow velocity, with a bivariate KDE. The core mass is adopted from Feng (2026, in preparation). In both panels, each orange dot represents an individual outflow, while the gray lines show the linear fits. The Spearman’s rank correlation coefficient (ρ), the corresponding p-value, and the best-fit parameters are indicated in each panel.
Other Images in This Article
Copyright and Terms & Conditions
© 2026. The Author(s). Published by the American Astronomical Society.

Copyright ©
2026 Astronomy Image Explorer. All Rights Reserved.
