

Image Details
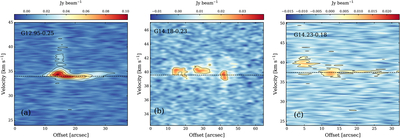
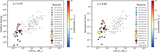
Caption: Figure 4.
PV diagrams of SiO (2–1) narrow-line-width, spatially extended SiO (2–1) components in G12.95–0.25, G14.18–0.23, and G14.23–0.18, extracted along the directions of the orange arrows shown in the velocity-integrated intensity maps (Figure 1). Black contours represent the narrow SiO (2–1) component, starting at 3σ and increasing in steps of 4σ, with 1σ = 0.0041 Jy beam−1. The black horizontal dashed line indicates the systemic velocity of the clump.
Other Images in This Article
Copyright and Terms & Conditions
© 2026. The Author(s). Published by the American Astronomical Society.

Copyright ©
2026 Astronomy Image Explorer. All Rights Reserved.
