

Image Details
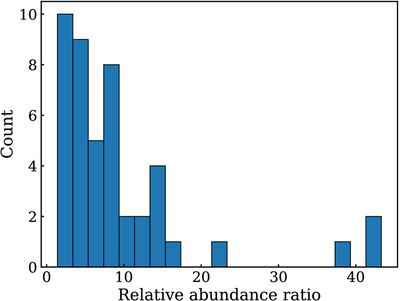
Caption: Figure 3.
Histogram of the relative SiO abundance ratio with respect to HCO+ for the outflow lobes detected in both SiO (2–1) and HCO+ (1–0) with S/N > 3. The bin width of 2 was chosen to balance resolution and statistical significance.
Other Images in This Article
Copyright and Terms & Conditions
© 2026. The Author(s). Published by the American Astronomical Society.

Copyright ©
2026 Astronomy Image Explorer. All Rights Reserved.
