

Image Details
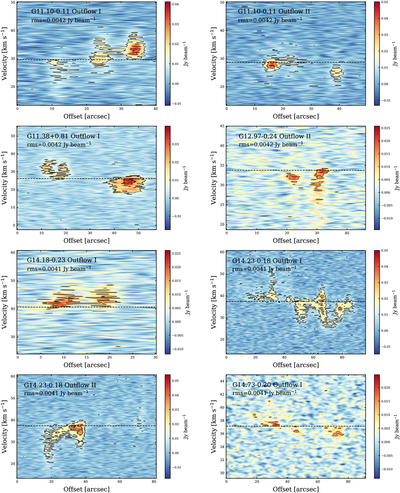
Caption: Figure 2.
PV diagrams of SiO (2–1) along the outflow direction axis (black arrows shown in the velocity-integrated intensity maps (panel (b)) of Figure 1, extracted using a slice width of one synthesized beam (3﹩\mathop{.}\limits^{{\unicode{x02033}}}﹩1), indicating episodic injection. Black contours represent the SiO (2–1) emission, starting at 3σ and increasing in steps of 4σ (the rms σ for each source is labeled in the respective panel). The increase in velocity with offset indicates the “Hubble wedge” structure (gray dashed lines). The black horizontal dashed line marks the systemic velocity of the central core.
Other Images in This Article
Copyright and Terms & Conditions
© 2026. The Author(s). Published by the American Astronomical Society.

