

Image Details
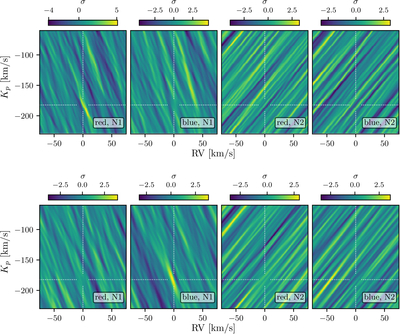
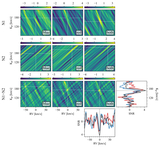
Caption: Figure 9.
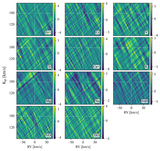
Top row: the results of the model injection–recovery test, as described in Section 5.2, for the atmospheric model generated for Fe. The four subplots display the results for the red and blue arms of the night 1 (first two panels) and night 2 (last 2 panels) data, respectively. The dashed white lines indicate the locations at which the model was injected, i.e., where we expect to recover the injected signal, and the color bars indicate the strength of the detected signal. The model was injected at a negative velocity in order to avoid boosting any real signal that was present in the data. In the case of Fe, we are only able to recover the injected model in the red arm of the night 1 data, at a significance of 5.1σ. Bottom row: the same as the top row, but for Ca. In this case, we are only able to recover the injected model in the blue arm of the night 1 data at 3.8σ.
Other Images in This Article
Show More
Copyright and Terms & Conditions
© 2026. The Author(s). Published by the American Astronomical Society.

